Dashboard
📖 Introduction
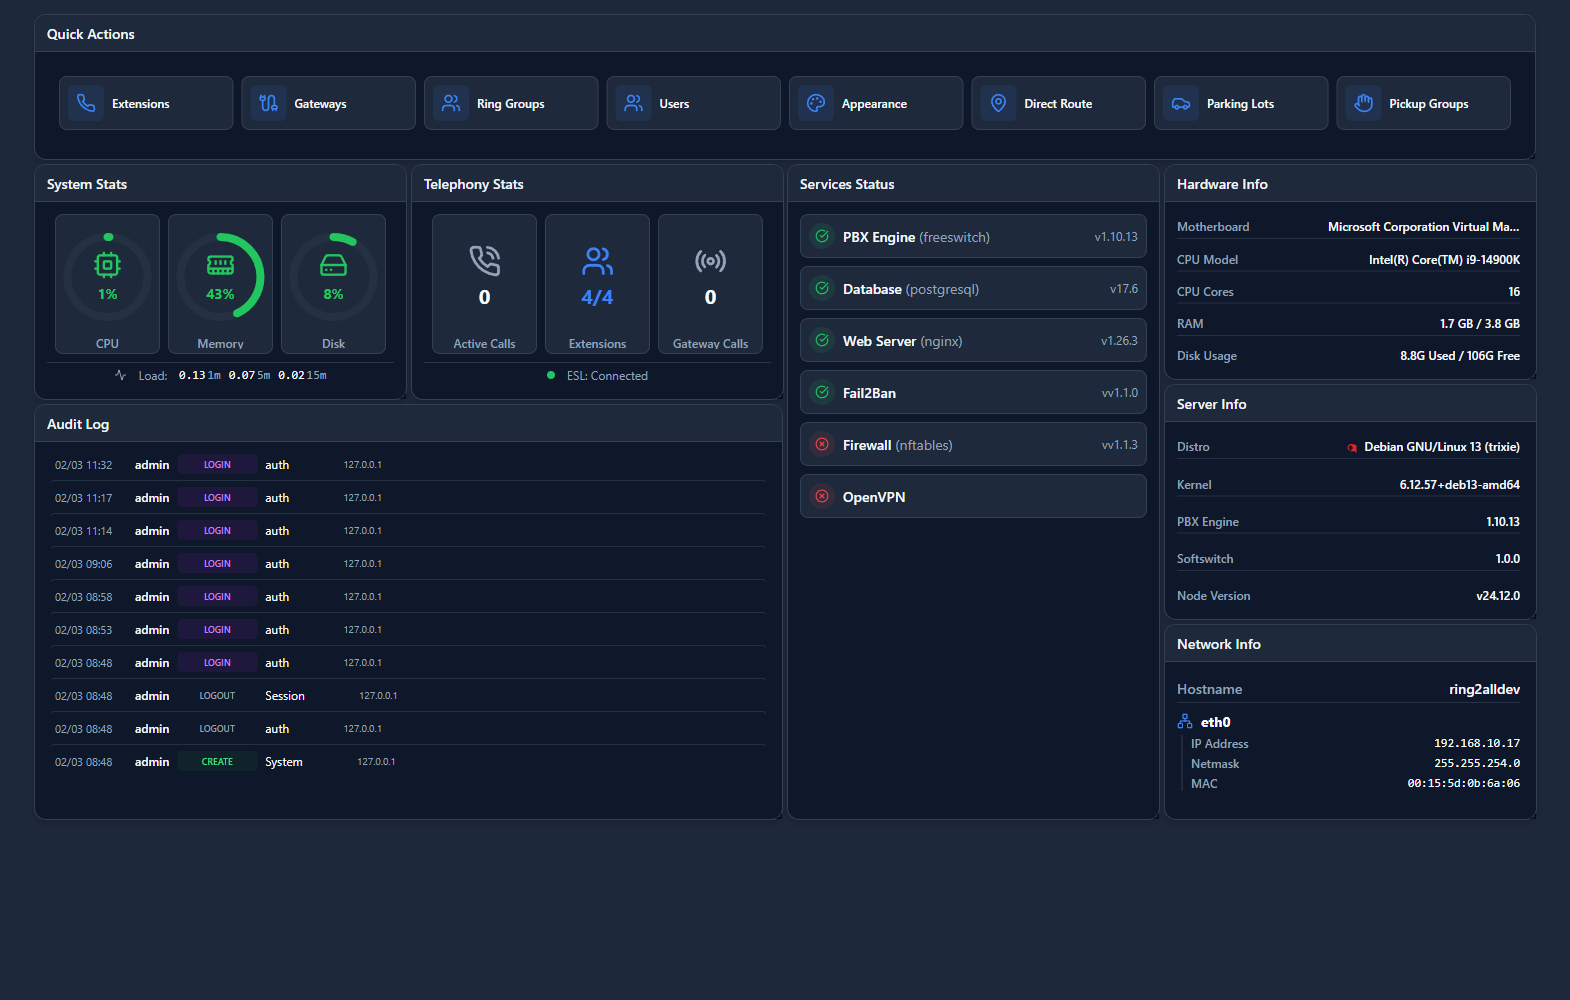
The Dashboard is your central overview of PBX activity. Monitor calls, system health, and key metrics at a glance with customizable widgets.
---
🖥️ Accessing the Module
Navigation:Dashboard (home page)
---
📊 Dashboard Widgets
Call Activity
| Widget | Shows | |
|---|---|---|
| Active Calls | Current live calls | |
| Calls Today | Total calls today | |
| Call Volume Graph | Hourly call chart | |
| Missed Calls | Missed call count |
System Health
| Widget | Shows | |
|---|---|---|
| System Status | Service health | |
| CPU/Memory | Resource usage | |
| Disk Space | Storage status | |
| Gateway Status | Trunk registrations |
Queue Statistics
| Widget | Shows | |
|---|---|---|
| Queue Summary | Calls waiting per queue | |
| Agent Status | Available/busy agents | |
| Avg Wait Time | Queue performance | |
| Abandoned Rate | Queue efficiency |
⚙️ Customization
Adding Widgets
- Click ⚙️ Customize button
- Select widgets to display
- Drag widgets to arrange
- Click Save
Widget Sizes
- Small (1x1)
- Medium (2x1)
- Large (2x2)
---
💡 Tips
TIP
Pin important widgets: Keep critical stats visible.TIP
Set refresh rate: Auto-update for real-time monitoring.---
🔗 Related Modules
- Active Calls — Detailed call monitor
- System Status — System health