

PBX Dashboard Module Documentation
Table of Contents
Section titled “Table of Contents”- Navigation & Access
- Screenshots & Visual Interface
- Module Overview (Technical)
- Module Overview (Commercial / Business)
- Module Overview (End User / Administrator)
- Widget Catalog & Capabilities
- Custom Grid Layout & Personalization
- Common Scenarios & Operational Use Cases
- Limitations & Important Notes
- Model Context Protocol (MCP) AI Integration
- Troubleshooting Tips
- Glossary
Navigation & Access
Section titled “Navigation & Access”To access the PBX Dashboard:
- Log in to the Ring2All Web Portal (
https://<domain-or-ip>/login). - In the left navigation sidebar, expand PBX Engine.
- Under PBX Tools, click Dashboard (
/pbx/tools/dashboardor/dashboard). - To modify widget arrangement, click the Edit Layout pencil button in the top control bar.
Screenshots & Visual Interface
Section titled “Screenshots & Visual Interface”PBX Dashboard Overview
Section titled “PBX Dashboard Overview”Customizable real-time dashboard featuring live telephony call metrics, extension registration counters, system resource utilization, service health statuses, and draggable widget cards.
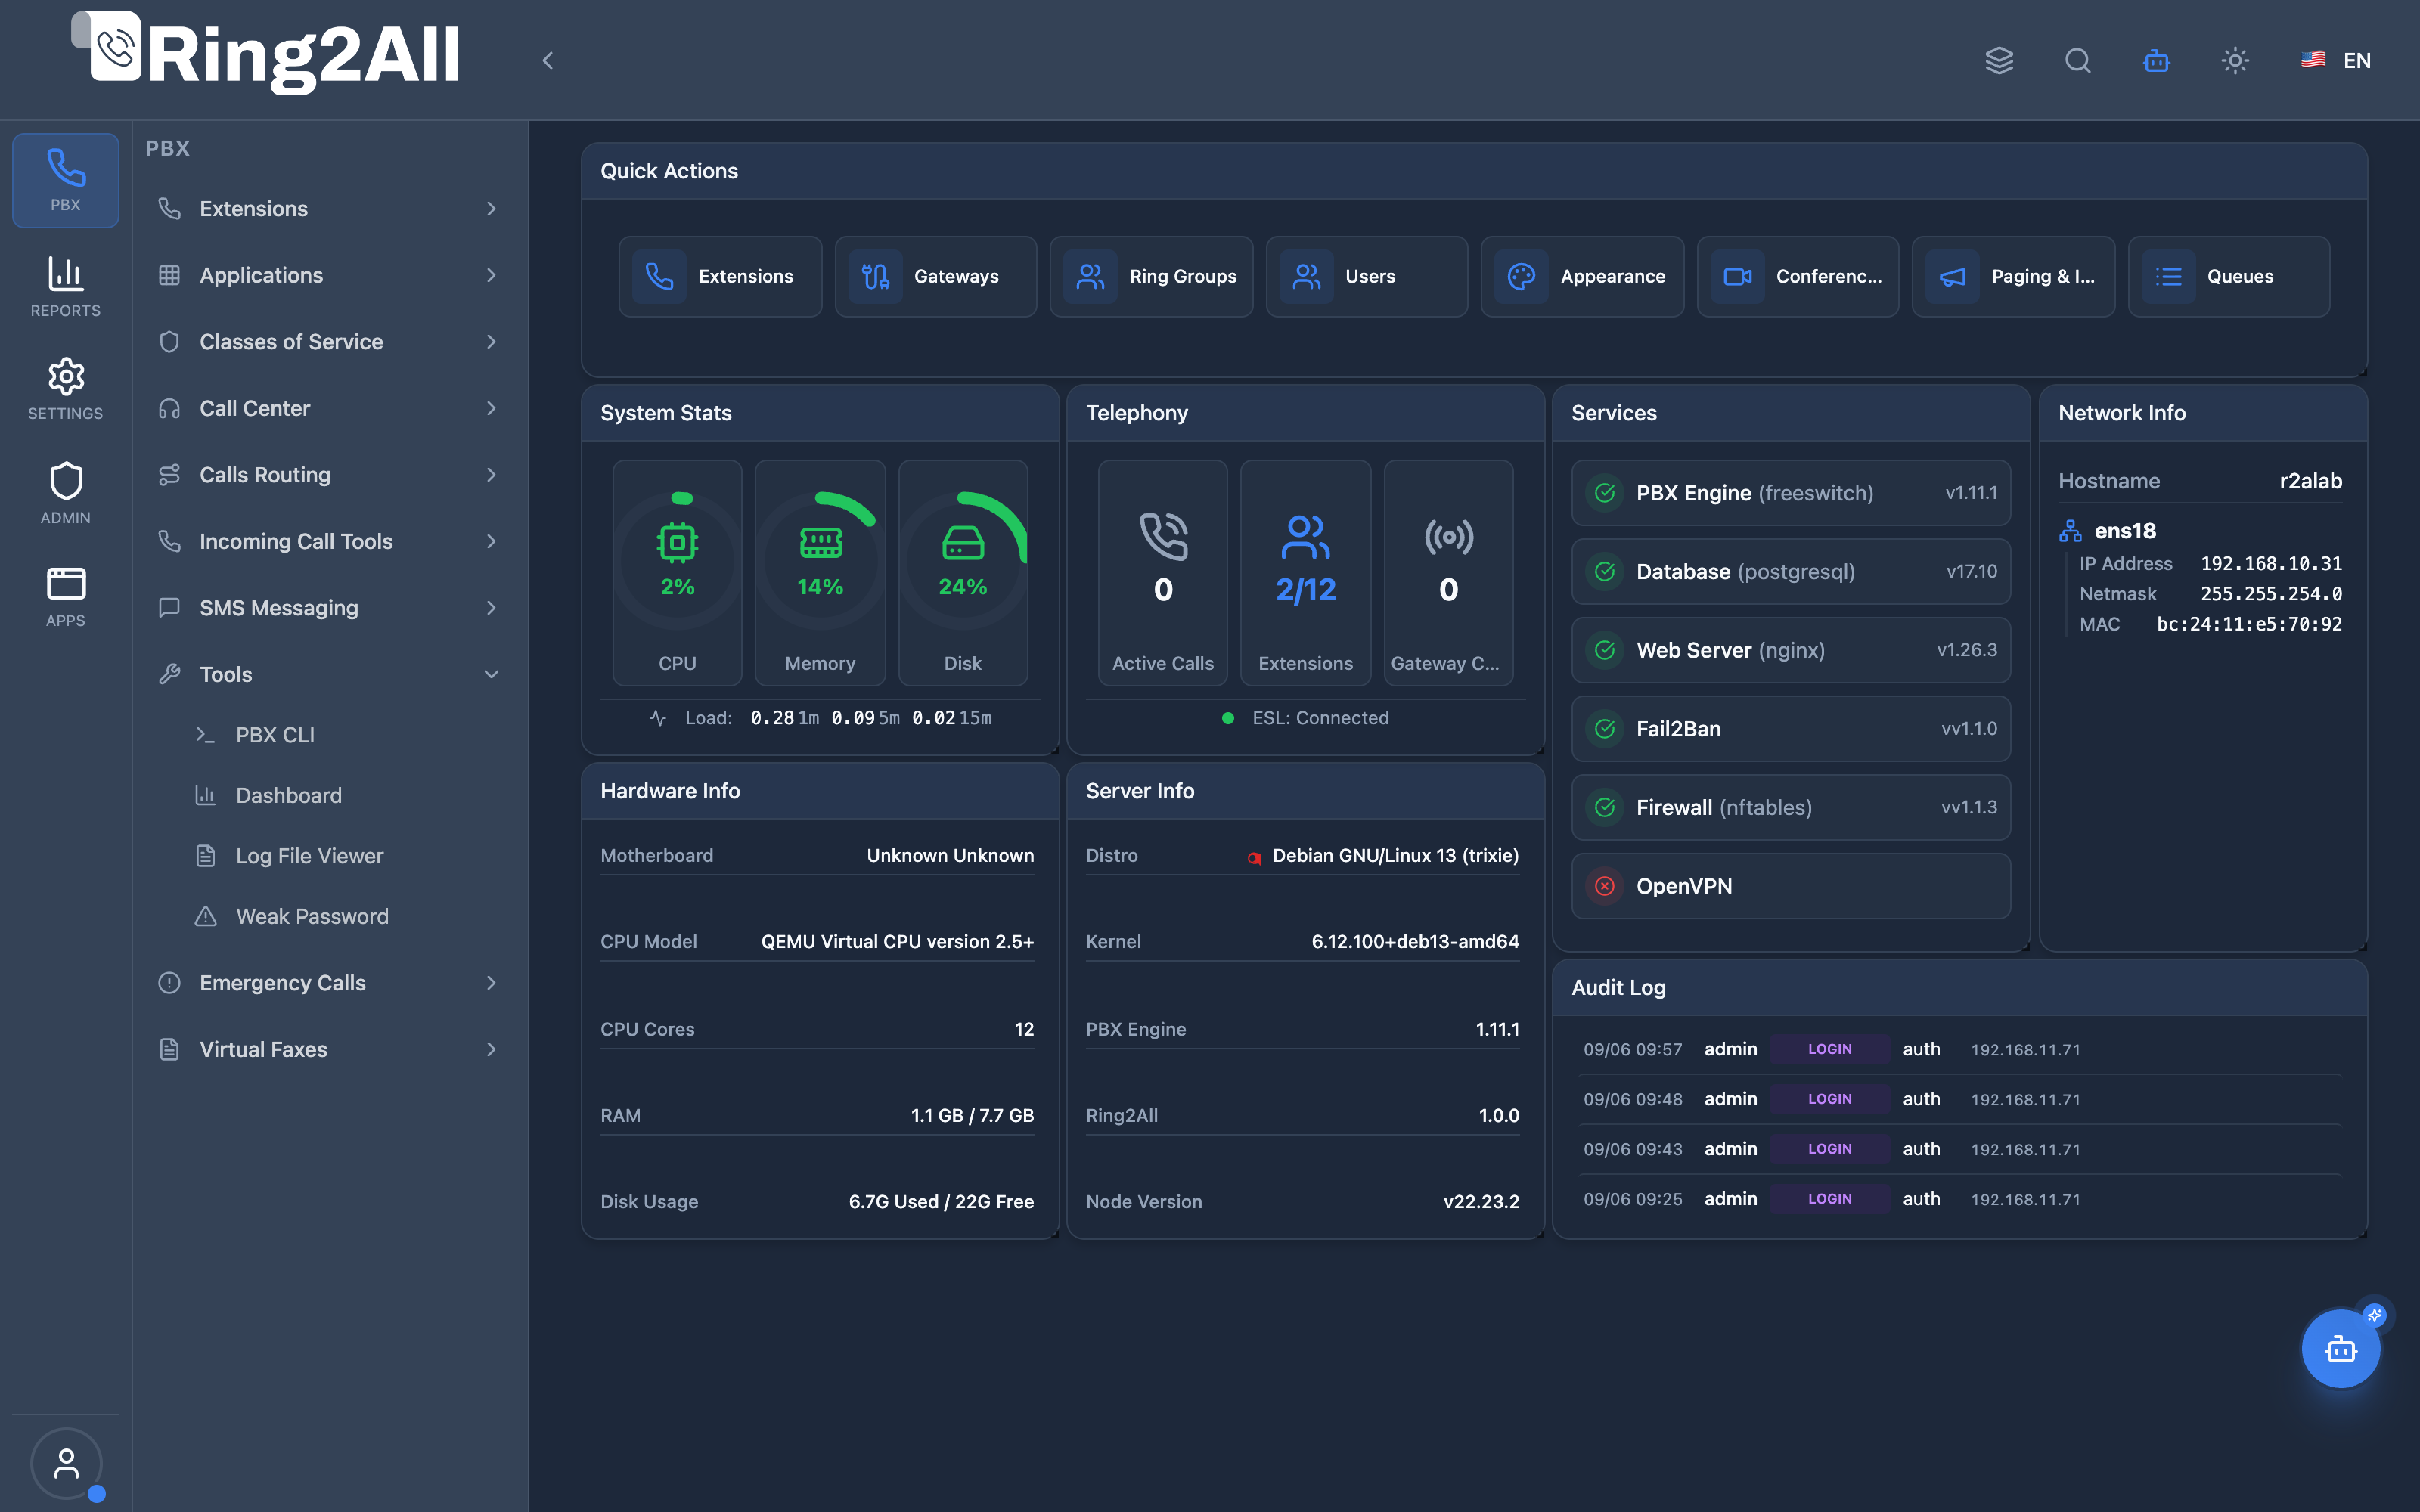
1. Module Overview (Technical)
Section titled “1. Module Overview (Technical)”What is the PBX Dashboard?
Section titled “What is the PBX Dashboard?”The PBX Dashboard is the primary visual operational cockpit for Ring2All administrators and telecom operators. It consolidates telephony engine statistics, SIP registration telemetry, server hardware metrics, and background service statuses into an interactive, real-time widget grid.
Technical Architecture
Section titled “Technical Architecture”- Grid Subsystem: Built on
react-grid-layoutwith responsive breakpoints (lg,md,sm,xs), providing seamless drag-and-drop repositioning and card resizing. - State Management: Uses Zustand stores (
dashboardEdit.tsanduseDashboardLayouts.ts) to persist user customized layout positions in local storage and backend user preferences. - Data Ingestion: Employs real-time WebSocket event listeners combined with lightweight periodic polling (
/api/telephony/dashboard/stats,/api/system/health) to ensure low server overhead while updating active call counters every 3,000 ms. - Component Isolation: Each widget card is encapsulated within an
ErrorBoundaryandWidgetWrapperso an individual metric timeout never crashes the overall dashboard view.
┌─────────────────────────────────────────────────────────────────┐│ PBX Dashboard Architecture │├─────────────────────────────────────────────────────────────────┤│ ││ React Frontend (DashboardPage.tsx) ││ ┌──────────────────────────────────────────────────────────┐ ││ │ Controls Bar: [Edit Layout] [Add Widget] [Reset] [Save] │ ││ └──────────────────────────────────────────────────────────┘ ││ ┌──────────────────────────────────────────────────────────┐ ││ │ Draggable & Resizable Grid Layout │ ││ │ ┌──────────────────────┐ ┌──────────────────────────┐ │ ││ │ │ Services Health │ │ Telephony Active Metrics │ │ ││ │ │ Telephony Server: OK │ │ Active Calls: 12 │ │ ││ │ │ Kamailio: OK │ │ Registered Exts: 48 │ │ ││ │ └──────────────────────┘ └──────────────────────────┘ │ ││ │ ┌──────────────────────┐ ┌──────────────────────────┐ │ ││ │ │ Hardware Resources │ │ Recent Security & CDRs │ │ ││ │ │ CPU: 14% RAM: 3.2GB │ │ Live Event Stream │ │ ││ │ └──────────────────────┘ └──────────────────────────┘ │ ││ └──────────────────────────────────────────────────────────┘ ││ │ WSS / REST Polling ││ ▼ ││ ┌────────────────────────┐ ││ │ Ring2All API & Daemons │ ││ └────────────────────────┘ │└─────────────────────────────────────────────────────────────────┘2. Module Overview (Commercial / Business)
Section titled “2. Module Overview (Commercial / Business)”Business Value & Executive Visibility
Section titled “Business Value & Executive Visibility”- Unified NOC Cockpit: Eliminates the need to toggle across multiple terminal windows or third-party monitoring platforms (e.g. Grafana, Datadog) to verify daily PBX operations.
- Rapid Incident Identification: Instantly exposes dropped carrier gateways, saturated SIP trunks, or memory spikes before customers experience degraded audio quality or busy signals.
- Capacity Planning: Visualizes peak call concurrent channels (CPS) to assist decision-makers in evaluating when additional trunk channels or cloud bandwidth are needed.
- Executive Oversight: Provides non-technical stakeholders with a clean, high-level summary of organization-wide telecom activity.
3. Module Overview (End User / Administrator)
Section titled “3. Module Overview (End User / Administrator)”Administrator Experience
Section titled “Administrator Experience”- View critical indicators at a glance upon logging in.
- Click Edit Layout to unlock drag handles and resize borders on any widget card.
- Click Add Widget to insert specific metrics (such as Queue Wait Times, Gateway Status, or Audit Feeds).
- Click Save Layout to lock changes across future sessions.
4. Widget Catalog & Capabilities
Section titled “4. Widget Catalog & Capabilities”| Widget Name | Data Source | Primary Metrics Displayed | Refresh Rate |
|---|---|---|---|
| Telephony Summary | Telephony Event Socket (ESL) / DB | Total Extensions, Registered Extensions, Active Calls, Channels. | Real-time / 3s |
| Services Health | Systemd / Kamcmd | Status of Telephony Server, Kamailio, PostgreSQL, Redis, and Web servers. | 10s |
| System Resources | Host OS /proc |
CPU utilization percentage, RAM usage, Swap, Storage disk space. | 5s |
| Carrier Gateways | Sofia SIP Status | State of outbound/inbound SIP trunk gateways (RUNNING, DOWN). | 10s |
| Call Volume Graph | CDR Telemetry | Visual bar/line chart of hourly inbound and outbound call distribution. | 30s |
| Quick Actions | Web Navigation | Direct shortcuts to Add Extension, Outbound Routes, or CDR search. | Static |
| Recent Alerts | Security Audit Log | Live feed of recent failed logins, blacklist triggers, or auth alerts. | Real-time |
5. Custom Grid Layout & Personalization
Section titled “5. Custom Grid Layout & Personalization”Editing the Dashboard
Section titled “Editing the Dashboard”- Click the Pencil (Edit Layout) icon on the top-right toolbar.
- The grid enters edit mode:
- Move: Click and drag any widget title bar to reposition it.
- Resize: Click and drag the lower-right corner handle of any widget.
- Add: Click + Add Widget to select cards not currently on screen.
- Remove: Click the
Xbutton on any unwanted widget card.
- Click the Save floppy disk icon to store the customized layout.
- If you wish to restore default factory positioning, click Reset Layout.
6. Common Scenarios & Operational Use Cases
Section titled “6. Common Scenarios & Operational Use Cases”Scenario 1: Morning Operational Verification
Section titled “Scenario 1: Morning Operational Verification”- The NOC engineer logs in at 8:00 AM.
- Inspects the Services Health card: all green badges confirm Telephony Server and Kamailio are active.
- Inspects Registered Extensions: confirms desk phones across all branch offices re-registered after overnight router reboots.
Scenario 2: Investigating Audio Complaints
Section titled “Scenario 2: Investigating Audio Complaints”- When an agent reports one-way audio, the administrator checks the System Resources widget.
- Identifies if server CPU or memory is constrained, or if active concurrent channels have spiked past license limits.
7. Limitations & Important Notes
Section titled “7. Limitations & Important Notes”- Browser Storage Persistence: Custom dashboard layouts are tied to user profiles and locally cached. Clearing browser cache resets the view unless saved to the server.
- Metrics Scope: Telephony metrics reflect the currently selected Tenant Domain unless logged in as a Superadmin with global platform scope enabled.
- Resource Protection: Polling frequency is throttled automatically when the browser tab is blurred or minimized to prevent background resource waste.
8. Model Context Protocol (MCP) AI Integration
Section titled “8. Model Context Protocol (MCP) AI Integration”The Ring2All Platform Copilot integrates with the PBX Dashboard via the Model Context Protocol (MCP) to provide proactive health summaries, active call counts, resource triage, and extension registration metrics in natural language.
Exposed MCP Tools
Section titled “Exposed MCP Tools”| Tool Name | Operation | Primary Parameters | Description |
|---|---|---|---|
get_system_dashboard_metrics |
Dashboard Aggregation | (none) | Returns core engine uptime, active calls summary, active channels count, registered extensions, domains, and gateway states. |
get_system_health |
Engine Status | (none) | Retrieves Telephony core uptime, active session rate (SPS), and resource metrics. |
get_active_calls |
Live Call Monitoring | limit (number, optional) |
Fetches the real-time list of currently active channels and bridged calls across the PBX. |
AI Safety Safeguards & Operational Controls
Section titled “AI Safety Safeguards & Operational Controls”- Read-Only Telemetry: Dashboard metrics queries are purely observational and cannot alter running call sessions or modify system configurations.
- Zero-Impact Polling: Metrics queries leverage lightweight cached data and asynchronous status commands to prevent Telephony Server event loop delays.
- Tenant Privacy Isolation: Active extension counts and gateway states are filtered strictly by tenant domain permissions.
Example MCP Payloads
Section titled “Example MCP Payloads”1. Inspecting Telephony Dashboard Overview (get_system_dashboard_metrics)
Section titled “1. Inspecting Telephony Dashboard Overview (get_system_dashboard_metrics)”{}Response:
{ "success": true, "data": { "telephonyEngine": "Telephony Server 1.11 Core", "status": "UP 3 days, 14 hours, 22 minutes, 10 seconds", "activeCallsSummary": "4 total.", "activeChannelsSummary": "8 total.", "metrics": { "totalDomains": 3, "activeExtensions": 48, "activeGateways": 2 }, "timestamp": "2026-09-08T15:30:00.000Z" }}2. Querying Real-Time Active Calls (get_active_calls)
Section titled “2. Querying Real-Time Active Calls (get_active_calls)”{ "limit": 10}Copilot Natural Language Prompts
Section titled “Copilot Natural Language Prompts”- “Give me a high-level health overview of our PBX system right now.”
- “How many active calls and channels are currently running on the server?”
- “Are all our SIP gateways and extensions registered properly?”
- “Show me the current CPU status and uptime of the Ring2All Telephony Engine.”
9. Troubleshooting Tips
Section titled “9. Troubleshooting Tips”| Symptom | Probable Cause | Corrective Action |
|---|---|---|
| Widgets show “Error loading data” | Backend monitoring API unreachable | Verify Fastify API service is running on port 3001. |
| Widgets overlap or fail to snap | Layout coordinates corrupted in local storage | Click Reset Layout on the control bar to reinitialize default coordinates. |
| Extension count shows 0 | Domain context unset | Verify that an active domain is selected in the top domain switcher dropdown. |
10. Glossary
Section titled “10. Glossary”- NOC: Network Operations Center.
- Widget: Independent modular UI card presenting specific data metrics.
- React-Grid-Layout (RGL): Draggable, resizable grid layout system for React.
- CPS: Calls Per Second — metric measuring call origination volume.